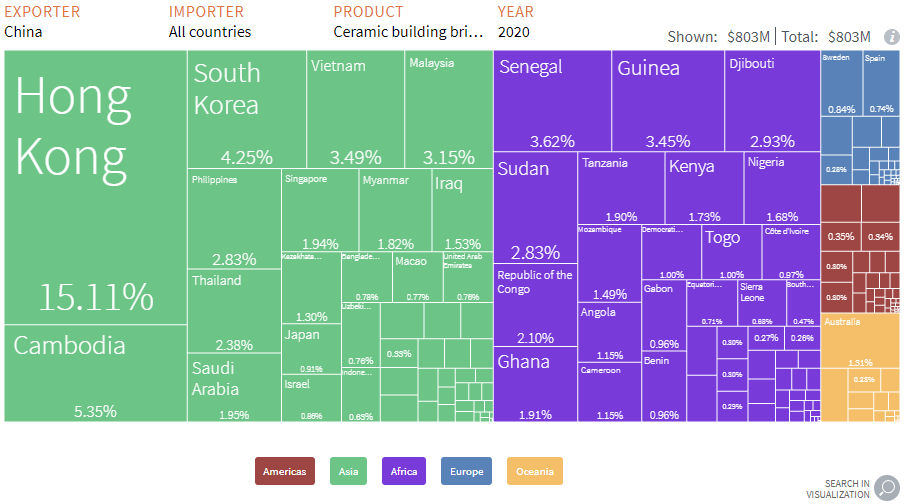
Through this map , it is for certain analyzed the values of China’s export to world in the product category of ceramic building bricks.As this is one exporter country focused graph , we focus on only China Republic’s export rate within those various import countries.
Published information in every 2 years period , Table 1.0 shows the numbers with statictical data of China’s export value of ceramic building bricks to different countries in whole continents.

With the color classification with various continents ,Asia and Africa are obviously primary importers of Chinese ceramic buildings and bricks products.While Hong Kong, Cambodia ,South Korea are leading importers of China , Senegal ,Guinea ,Dijbouti and Sudan representing their import rates from Africa.
As Hong Kong leading their import by only 120 million $ from China, which definetely shows the improtance of closer market’s advantage of importing ceramic building bricks.Therefore neighbor countries with China , has become a good resource of selling these items in terms of international trade.
In total of 803 million $ export market cap of China within this market , China has dominated its market domanince in both Asia and African countries.In Europe , Sweden is leading China’s export value with %0,84 of total value calculalted which is overall 6,78 million $.Spain %0,74 and Russia by %0,36.
Therefore ,considered building materials of ceramic bricks not seem very popular in Europe considering in terms of shipping costs , market alternatives, market entry options etc.
Resource: The Atlas of Economic Complexity – Harvard University
